The song graph

99130

Songs

Songs have properties like artist, title, and release year. Songs are connected by similarity relationships. Around a third of all songs in the database have full information about tags, words, year, artist and title.

152775

Tags

Tags are user defined phrases. These might be a genre like "rock" or descriptions of something, the tagged songs may have in common like "sad" or "title is a full sentence".

5000

Words

We are taking a network-based bag-of-words approach. Our database contains the 5000 most common words across the songs where lyrics are available.

Why are songs building a network you ask? Songs, Tags, Words, what the heck? Have a look below! This graph illustrates the basic structure of our song graph with a small example. Songs () can have directed similarity relationships between each other. These relationships form a very dense graph, so that the giant connected component contains over 90% of all nodes for which we have information about similar songs. As you can see, you even find a path between Taylor Swift and Cannibal Corpse.

Furthermore, our graph contains user defined tags () 
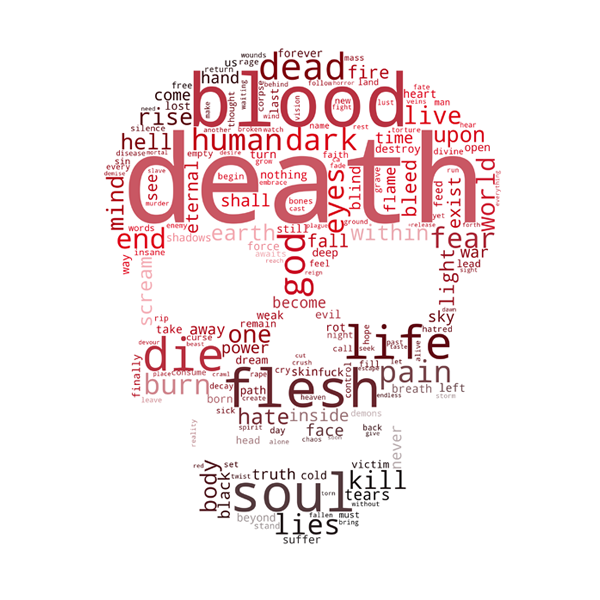
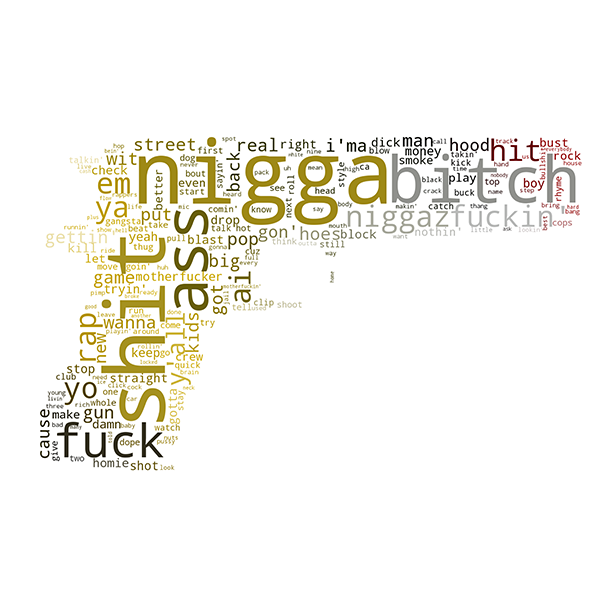
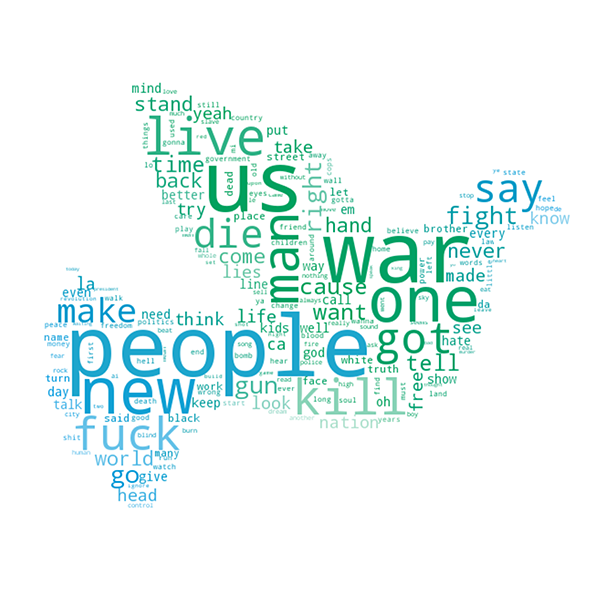
and lyric words (). Tags are added to songs by users and often contain genre information. The collection of words a song is linked to forms a bag-of-words description of the lyrics. Obviously, the intermediate nodes have themselves multiple similarity, tag and word relationships, which are ommitted here to keep it simple.

Drag the nodes and have fun while you are preparing to dive into the world of music.

Network statistics

Degree distribution of song similarity

This is the degree distribution of both incoming and outgoing similarity relationships for all song nodes. This network will not scale freely as the maximum degree seems to have an upper bound.

Degree distribution of tags

The degree distribution of tags (how many songs are tagged with a particular tag) closely follows a power law. As the network size increases, new nodes will show a preference to be tagged by tags with high degree.

Year distribution of the songs

Looking at the year distribution graph we find that most of the songs are from the 21st century with decreasing amounts the older the songs are. The observed years range from 1926 to 2010 with 2007 being the year with most songs. We are thus dealing with mostly recent music and some old and very old pieces.

10 most popular Tags

Here we can see the tags that have the most songs. We can see that the most popular tags almost exclusively describe musical genres.

10 artists with most songs

Here we can see the artists that have the most songs, this can be both seen as an indicator of popularity and productiveness of an artist

Lyrics and Tags

One of the great features of the dataset is lyrics information available as bags of words. They allow us to find characteristic words for selected tags using TF-IDF scores. Below you find some wordclouds highlighting the words with the highest scores among all songs that are tagged by a particular tag.

Death Metal

Gangsta Rap

Political

Country

Sentiment analysis

Sentiment over the years

A first step to understand natural language is to determine how positive or negative a statement is (sentiment). Here we investigate the average sentiment of lyrics per year from 1926 to 2010. The sentiment score can be seen as a happiness score, with high values for positive language.

This graph shows the average sentiment per year based on the lyrics of all songs released in a year. The high fluctuations before 1960 are due to the comparatively small amount of available data in these years which results in a high standard deviation (remember the year distribution). Can you see the peak around 1968? We think the hippies are to blame. Also, it may be a coincidence due to the high uncertainty, but the global maximum lies just at the end of WWII.

These days music seems to have become more negative than in the earlier days. This might, however, be a false conclusion as we are probably only considering the music that remained known and popular until today, which introduces a bias.

Sentiment for different tags

Click here to see the top 100 tags ordered by average sentiment. It provides some insights into the negativity of certain music genres. For most of the scale though, it is not immediately obvious why some tags are more positive than others.

Tag communities

Welcome to the great finale. Here we see a graph of tags. Two tags are connected when they share enough Songs (the two sets of associated songs have a Jaccard index of more than 0.1). The coloring was obtained by running the Louvain community detection algorithm. See how similar tags end up in the same community. In a way, these can be seen as areas of music which split up into sub-genres and merge into other areas.

Code and Data

The explainer notebook provides explanation, implementation, and discussion of the applied techniques. In order to be able to run the code in Anaconda without creating the database yourself, you will need the following:

  • Neo4j Community Edition: make sure to set the config variable "dbms.security.auth_enabled" to "false" to allow unauthorized local connections
  • The ipython-cypher module ("pip install neo4jrestclient ipython-cypher")
  • The dump of our database.
  • Start Neo4j, select the location of the extracted dump as database, run the notebook

That's all, folks!